Analysis and evaluation of power quality data with interactive visualizations and reports

The main scope of Adaptricity.PQ is to summarise a large amount of data to provide an actionable overview to the grid operator. This not only allows a quick setup, but also keeps the functionalities to the very essential to provide a smooth user experience. We deliver an intuitive and dynamic user interface and user experience to enhance overall situational awareness.

As the needs of our customers evolve, so does the product. Whenever specific needs arise, we are keen to design and implement with our customers tailored plug-ins to provide new value. The product can be customised to visualise various types of measurements, including new types of events and non-electrical quantities.

Adaptricity.PQ is a cloud-based solution that allows grid operators to view metering data geographically in real- time or quasi real-time. With Adaptricity.PQ you can visualise and explore data from smart meters and power quality devices, summarising and reporting harmful events in a convenient dashboard. The grid operator has a complete overview of the current and past measurements of its devices.

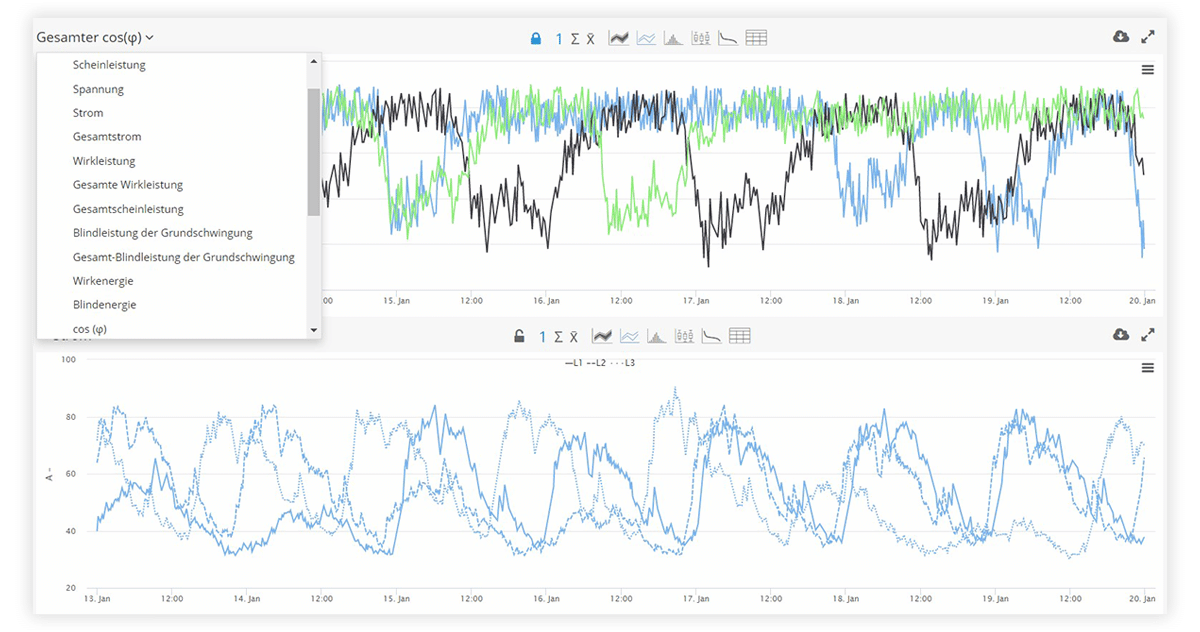
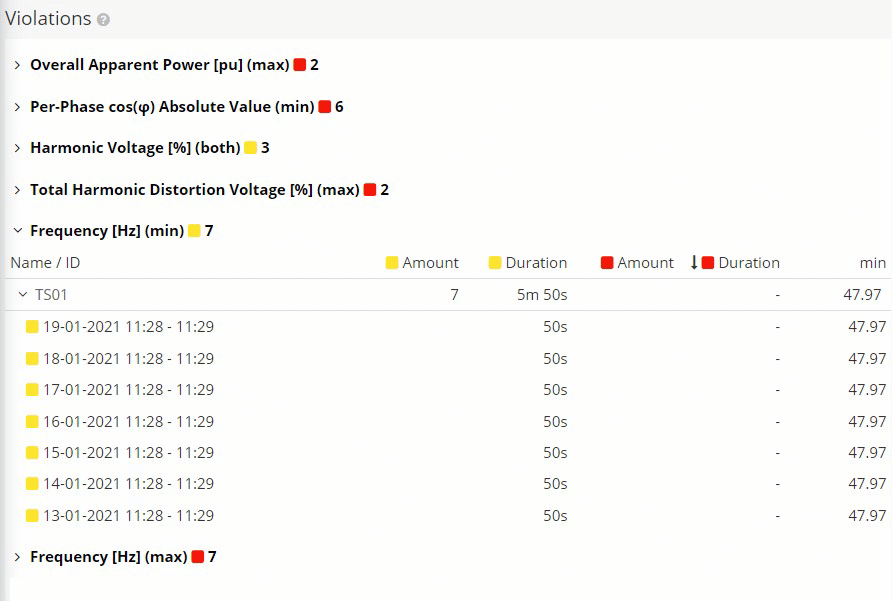
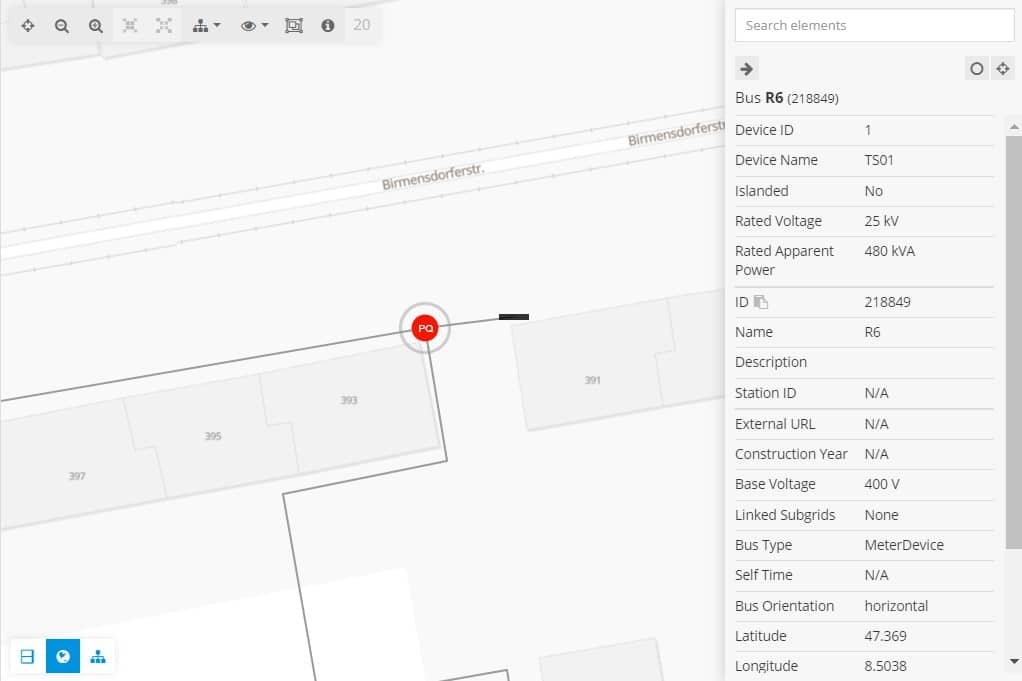
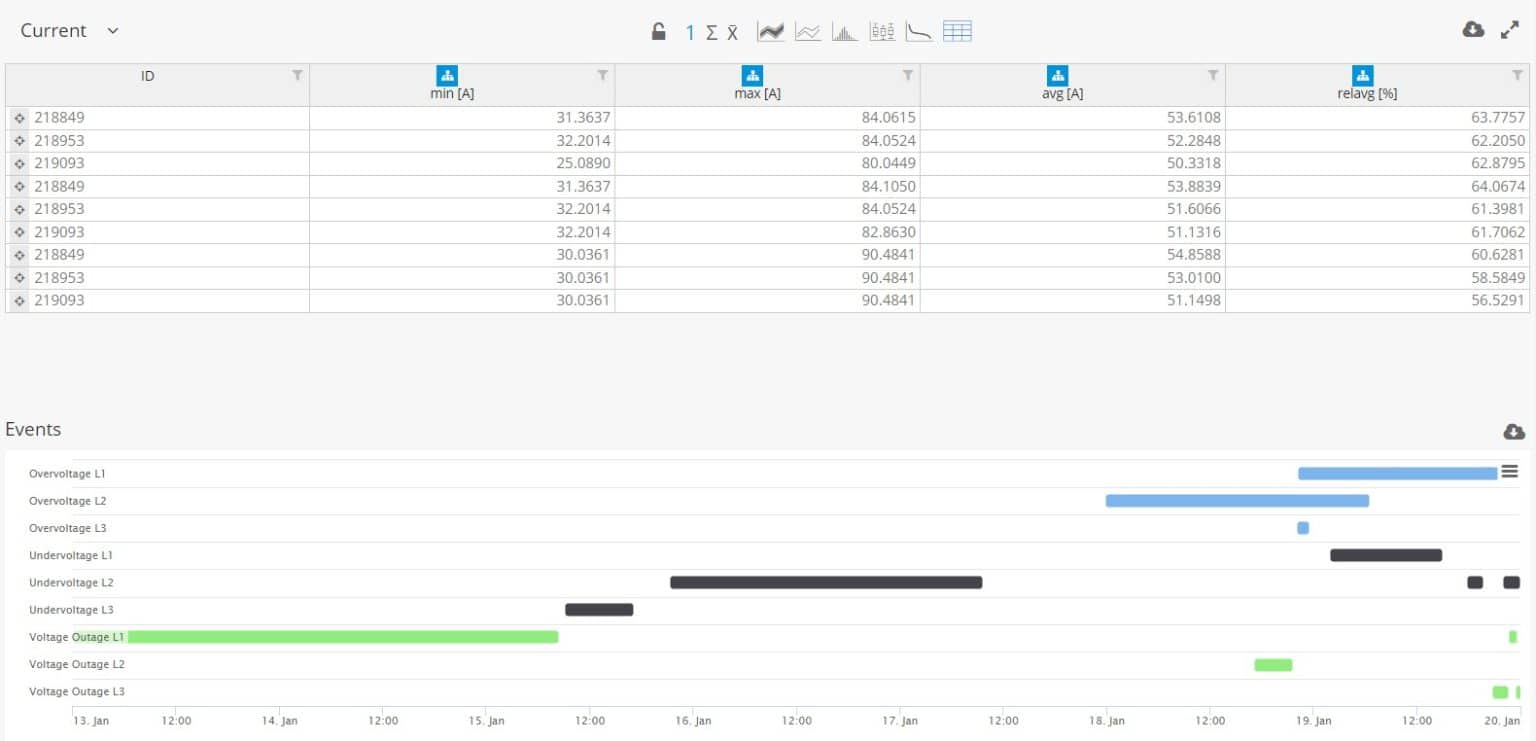
Our entry-level product Adaptricity.PQ allows visualization of existing measurement data, e.g. from PowerQuality devices in transformer stations and distribution cabins, with the same graphical interface, even without a network model. We evaluate the data in a structured way to detect limit violations and make unfavourable trends in network operation visible. A complete voltage quality report according to EN 50160 can be generated at the push of a button.

What comes with Adaptricity.PQ

  • Integration and visualisation of both values of field measurements and event-related diagnostic information from the metering devices, such as over and under voltage, unbalanced voltage, meter failures.
  • Computation and reporting of alerts according to several regional regulations (e.g. EN 50160)
  • Reporting functionality with creation of PDF documents.
  • Possibility of co-developing custom detection methods for leak detection, neutral integrity, and demand management features.

More about Adaptricity.PQ

Adaptricity.PQ is only the entrance door to the ecosystem of tools available in the Adaptricity platform. Once a computable grid model is integrated, Adaptricity.PQ can be upgraded to Adaptricity.Mon, bringing the analytic potential to the next level. Exploiting the combination of the grid model with the close-to-realtime meter data, Adaptricity.Mon runs large-scale simulations and offers tools to automatise daily operations, such as:

  • Monitoring of further operational grid parameters such as line loadings or node voltages
  • Workflows for streamlining the approval of connection requests based on real data
  • Execution of short-circuit computations
  • Planning and assessment of protection schemes
  • Stress-tests with automated Monte-Carlo simulations
  • …and many more.

How is Adaptricity.PQ set up?

Adaptricity.PQ funktioniert, ohne dass ein berechenbares Gittermodell erforderlich ist. Die einzige Voraussetzung ist der Standort der Zähler. Zur Verbesserung der Visualisierung kann jedoch eine vollständige Gitterdarstellung importiert werden.

Adaptricity.PQ works without the need of a computable grid model. The only requirement is the location of the meters. A whole grid representation can however be imported for improving the visualisation experience. Once the meters are active and the APIs are implemented, you only need to insert the API login credentials in the configuration dashboard and define the geographical locations of the devices. The data will be pulled on a regular basis and made available for visualisation and reporting.

Instant availability, fast installation, immediate benefits – Adaptricity.PQ

Download the brochure