.dynamisch .datengetrieben .smart
Our super-efficient time series simulation engine offers a variety of algorithms. Simulate dynamic systems to enable flexible grid planning.
The integration of different data sources provides answers to complex questions, and means you will always be working with the most up-to-date data.
Run parallel simulations, and benefit from the automatic control of simulations via our web interface. Keep the overview with straightforward evaluations tailored to your grid analytics needs.
In the future, grid planning and operation will demand an increasingly flexible planning and simulation environment that allows for time-series-based simulations of active distribution grids. Our cloud-based tool, Adaptricity.Sim, with its unique functionality and intuitive usability, is the answer.
Adaptricity.Sim – how it works
Adaptricity.Sim is tailored to detailed analyzes of the distribution grid based on time series simulations with real measured data. A sophisticated prosumer model allows the new energy world to be realistically represented in the grid simulator: Households own not only electricity-consuming devices, but also generators and decentralized battery storage. Self-consumption tariffs change customers' electricity purchasing behavior. Intelligent grid resources such as voltage regulators and controllable local grid transformers stabilize the grid. Perhaps even large thermal storage systems will provide flexibility for the grid via power-to-heat applications. With Adaptricity.Sim, you map all effects in a digital twin and get detailed insights into the operational behavior of future power grids.
Time-series based grid simulation studies

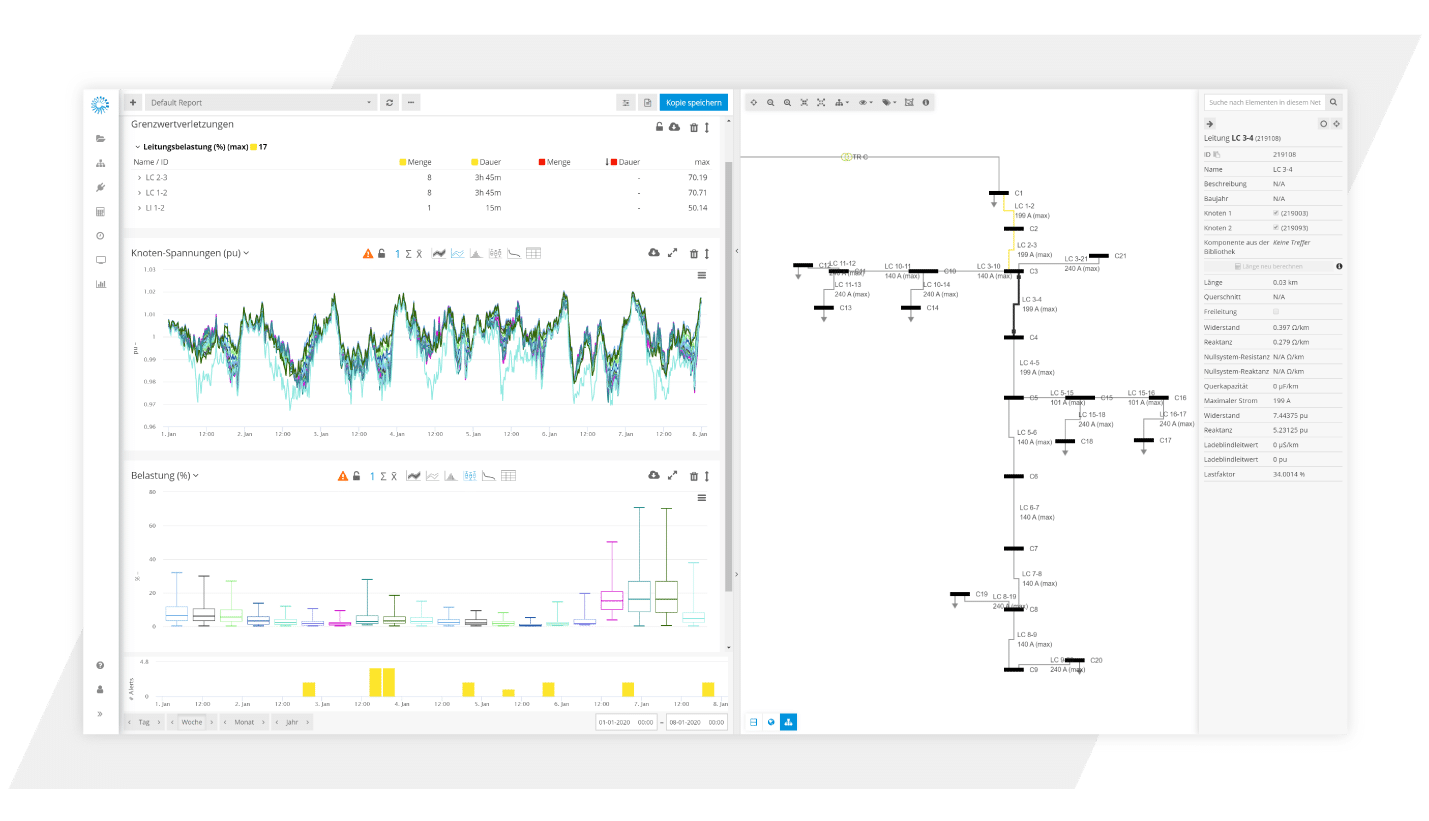
List of all limit violations over the displayed time period
Line diagram of node voltages
Box-Whisker plot displaying line loads
Overview of all warnings and limit violations displayed on the time axis
Representation of the grid topology showing limit violations
Details of individual grid elements
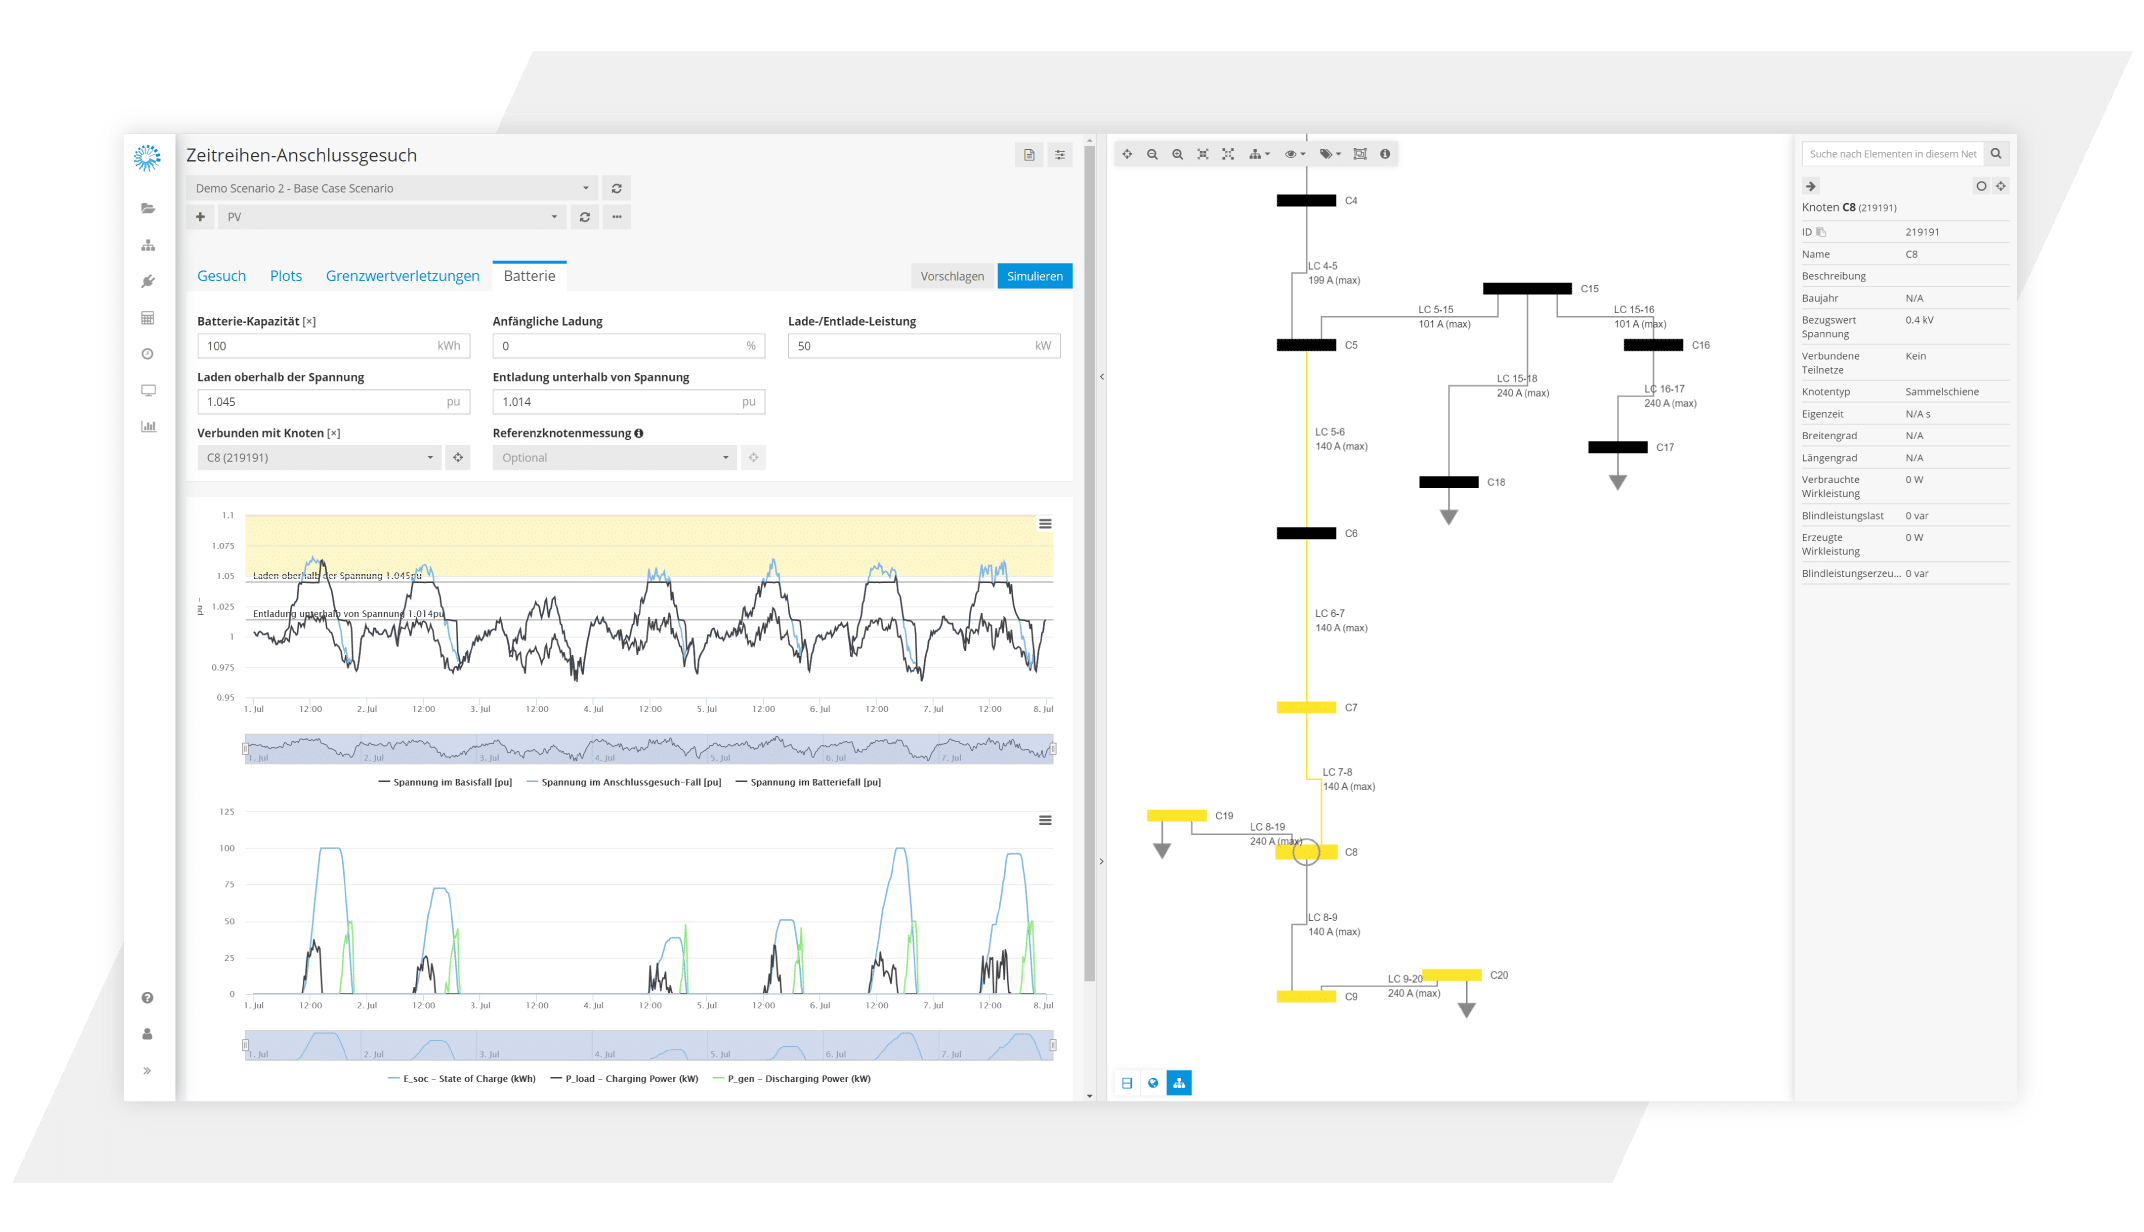
Time-series based connection requests

Limit violations are displayed directly on the grid topology
Choose the functionality you want to use: Set parameters for the request, view result plot, overview of limit violations, or battery dimensioning
Select the time series to display: simulation base case, simulation connection request, or simulation with battery
Quantile plot of line loads
Quantile plot of node voltages
Battery simulations

Representation of the grid topology showing limit violations
Configuration of the battery parameters
Power input and output of the battery
Battery charge status
© 2022 All rights reserved | Powered by SIDORA AG
| Cookie | Duration | Description |
|---|---|---|
| cookielawinfo-checkbox-advertisement | 1 year | Set by the GDPR Cookie Consent plugin, this cookie is used to record the user consent for the cookies in the "Advertisement" category . |
| cookielawinfo-checkbox-analytics | 11 months | This cookie is set by GDPR Cookie Consent plugin. The cookie is used to store the user consent for the cookies in the category "Analytics". |
| cookielawinfo-checkbox-functional | 11 months | The cookie is set by GDPR cookie consent to record the user consent for the cookies in the category "Functional". |
| cookielawinfo-checkbox-necessary | 11 months | This cookie is set by GDPR Cookie Consent plugin. The cookies is used to store the user consent for the cookies in the category "Necessary". |
| cookielawinfo-checkbox-others | 11 months | This cookie is set by GDPR Cookie Consent plugin. The cookie is used to store the user consent for the cookies in the category "Other. |
| cookielawinfo-checkbox-performance | 11 months | This cookie is set by GDPR Cookie Consent plugin. The cookie is used to store the user consent for the cookies in the category "Performance". |
| CookieLawInfoConsent | 1 year | Records the default button state of the corresponding category & the status of CCPA. It works only in coordination with the primary cookie. |
| elementor | never | This cookie is used by the website's WordPress theme. It allows the website owner to implement or change the website's content in real-time. |
| PHPSESSID | session | This cookie is native to PHP applications. The cookie is used to store and identify a users' unique session ID for the purpose of managing user session on the website. The cookie is a session cookies and is deleted when all the browser windows are closed. |
| viewed_cookie_policy | 11 months | The cookie is set by the GDPR Cookie Consent plugin and is used to store whether or not user has consented to the use of cookies. It does not store any personal data. |
| Cookie | Duration | Description |
|---|---|---|
| _ga | 2 years | The _ga cookie, installed by Google Analytics, calculates visitor, session and campaign data and also keeps track of site usage for the site's analytics report. The cookie stores information anonymously and assigns a randomly generated number to recognize unique visitors. |
| _gat_gtag_UA_143308488_1 | 1 minute | Set by Google to distinguish users. |
| _gat_gtag_UA_50068507_1 | 1 minute | Set by Google to distinguish users. |
| _gid | 1 day | Installed by Google Analytics, _gid cookie stores information on how visitors use a website, while also creating an analytics report of the website's performance. Some of the data that are collected include the number of visitors, their source, and the pages they visit anonymously. |
| CONSENT | 2 years | YouTube sets this cookie via embedded youtube-videos and registers anonymous statistical data. |
| Cookie | Duration | Description |
|---|---|---|
| VISITOR_INFO1_LIVE | 5 months 27 days | A cookie set by YouTube to measure bandwidth that determines whether the user gets the new or old player interface. |
| YSC | session | YSC cookie is set by Youtube and is used to track the views of embedded videos on Youtube pages. |
| yt-remote-connected-devices | never | YouTube sets this cookie to store the video preferences of the user using embedded YouTube video. |
| yt-remote-device-id | never | YouTube sets this cookie to store the video preferences of the user using embedded YouTube video. |
| Cookie | Duration | Description |
|---|---|---|
| sw | 1 year | No description available. |